* Updated June 15th, 2021
The United States travel market is the largest in the world, as, in 2019, the number of international tourist arrivals to the U.S. stood at almost 80 million after being on the rise for over a decade. In the same year, the number of international tourist arrivals to the U.S. reached nearly 80 million, after being on the rise for more than a decade. The pandemic has not affected bookings in the USA, as we would expect, because while the travel restrictions abroad are still in place people tend to travel across the country.
This article will shed light on the distribution of bookings for the most popular online travel agents (OTAs), the last 4 years.
We have collected booking data from USA Hosthub customers from the past 3 years – more than 500.000 bookings in total–, and broke down the data per source channel. Here are the results:
Percentage of bookings per channel per month


Click the graph to zoom in
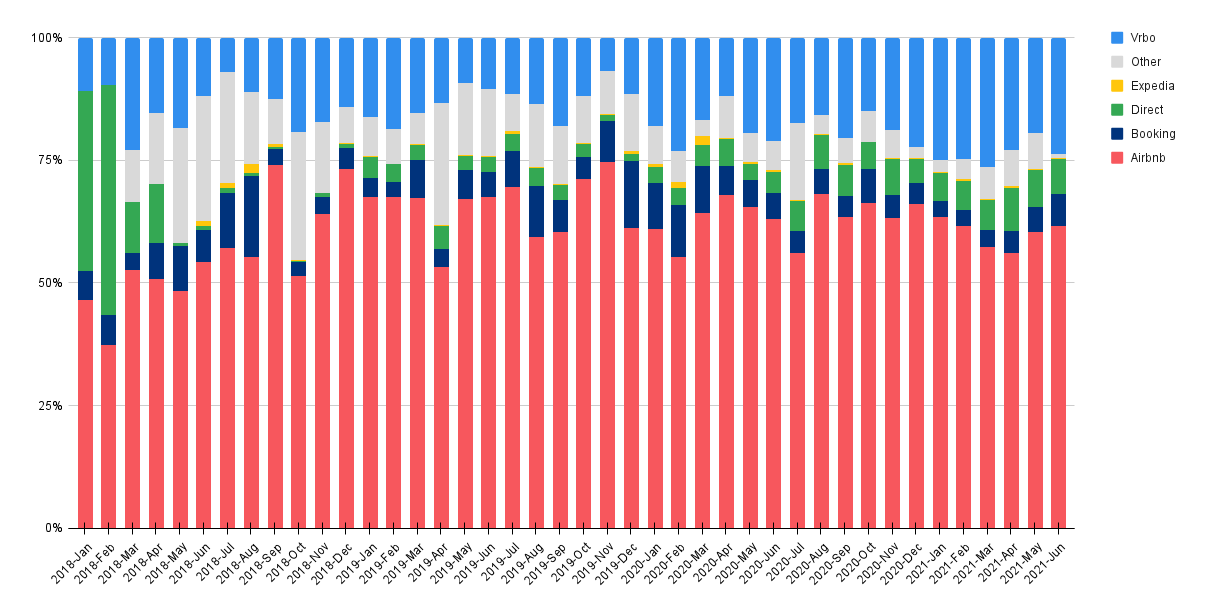
Αirbnb dominates the USA market in the last 4 years, representing 64% of the OTA market, in May & 62% in June.
If we look at the correlation and the percentage of bookings in each channel we will find out that the second most powerful channel is Vrbo. In the United States, during the pandemic, travel between states was not prohibited. This means that STR bookings held their ground, and sites such as Vrbo increased in popularity, securing 20% of bookings in May 2021 and a 24% share in June.
On the contrary to the global picture, in the USA, Booking.com is not popular, securing only 7% of bookings in June. Direct bookings’ share seems to be increasing slowly in contrast to Europe.
The pandemic has not affected the distribution of the bookings as we would expect. This is probably because hosts with rentals in the USA have not stopped receiving new bookings during the pandemic. Airbnb is by far the leader, with Vrbo in second place during the last 3 years.
But which are the dominant channels in the rest of the world? Let’s explore this in our next article!
This article will be updated monthly.
Distribution of booking sources per month – Global
Distribution of booking sources per month – All the world excluding the USA